Business Intelligence is a set of methodologies and software tools for identifying, extracting and analyzing business data that enable:

  • more efficient use of data
  • converting data into information needed to make business decisions

Power Business Intelligence provides easy access to public or corporate data:

  • Searching through public or corporate data
  • Selection and transformation of data for easier analysis
  • Linking data from different sources
power bi sales marketing

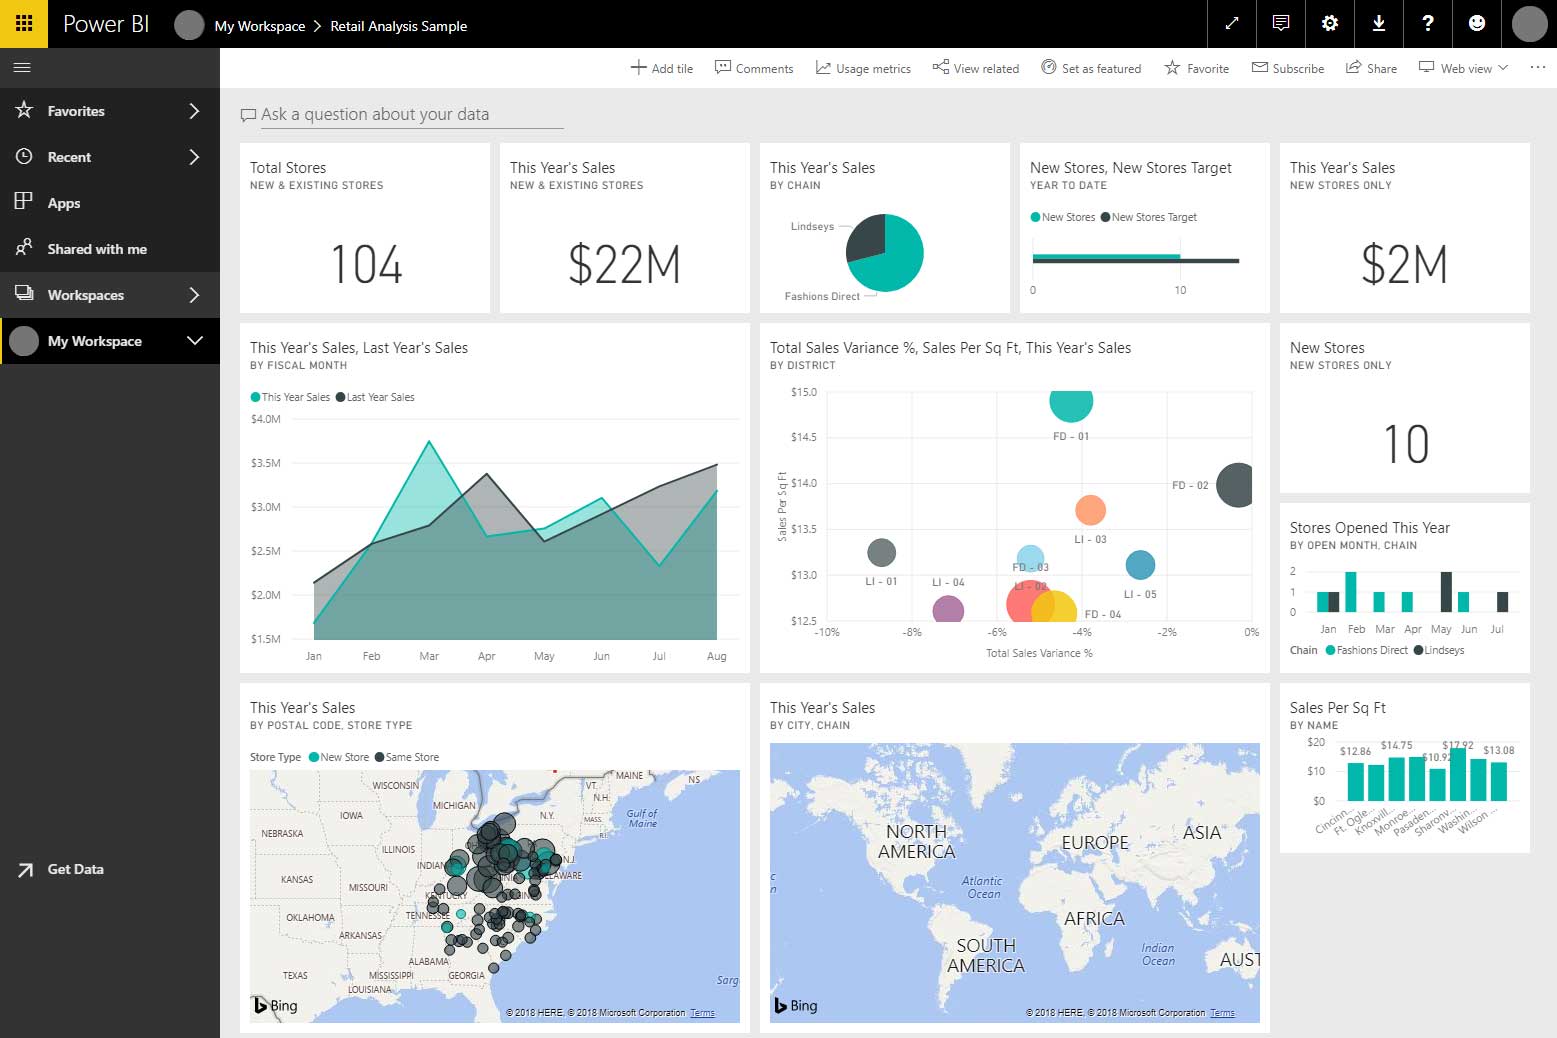
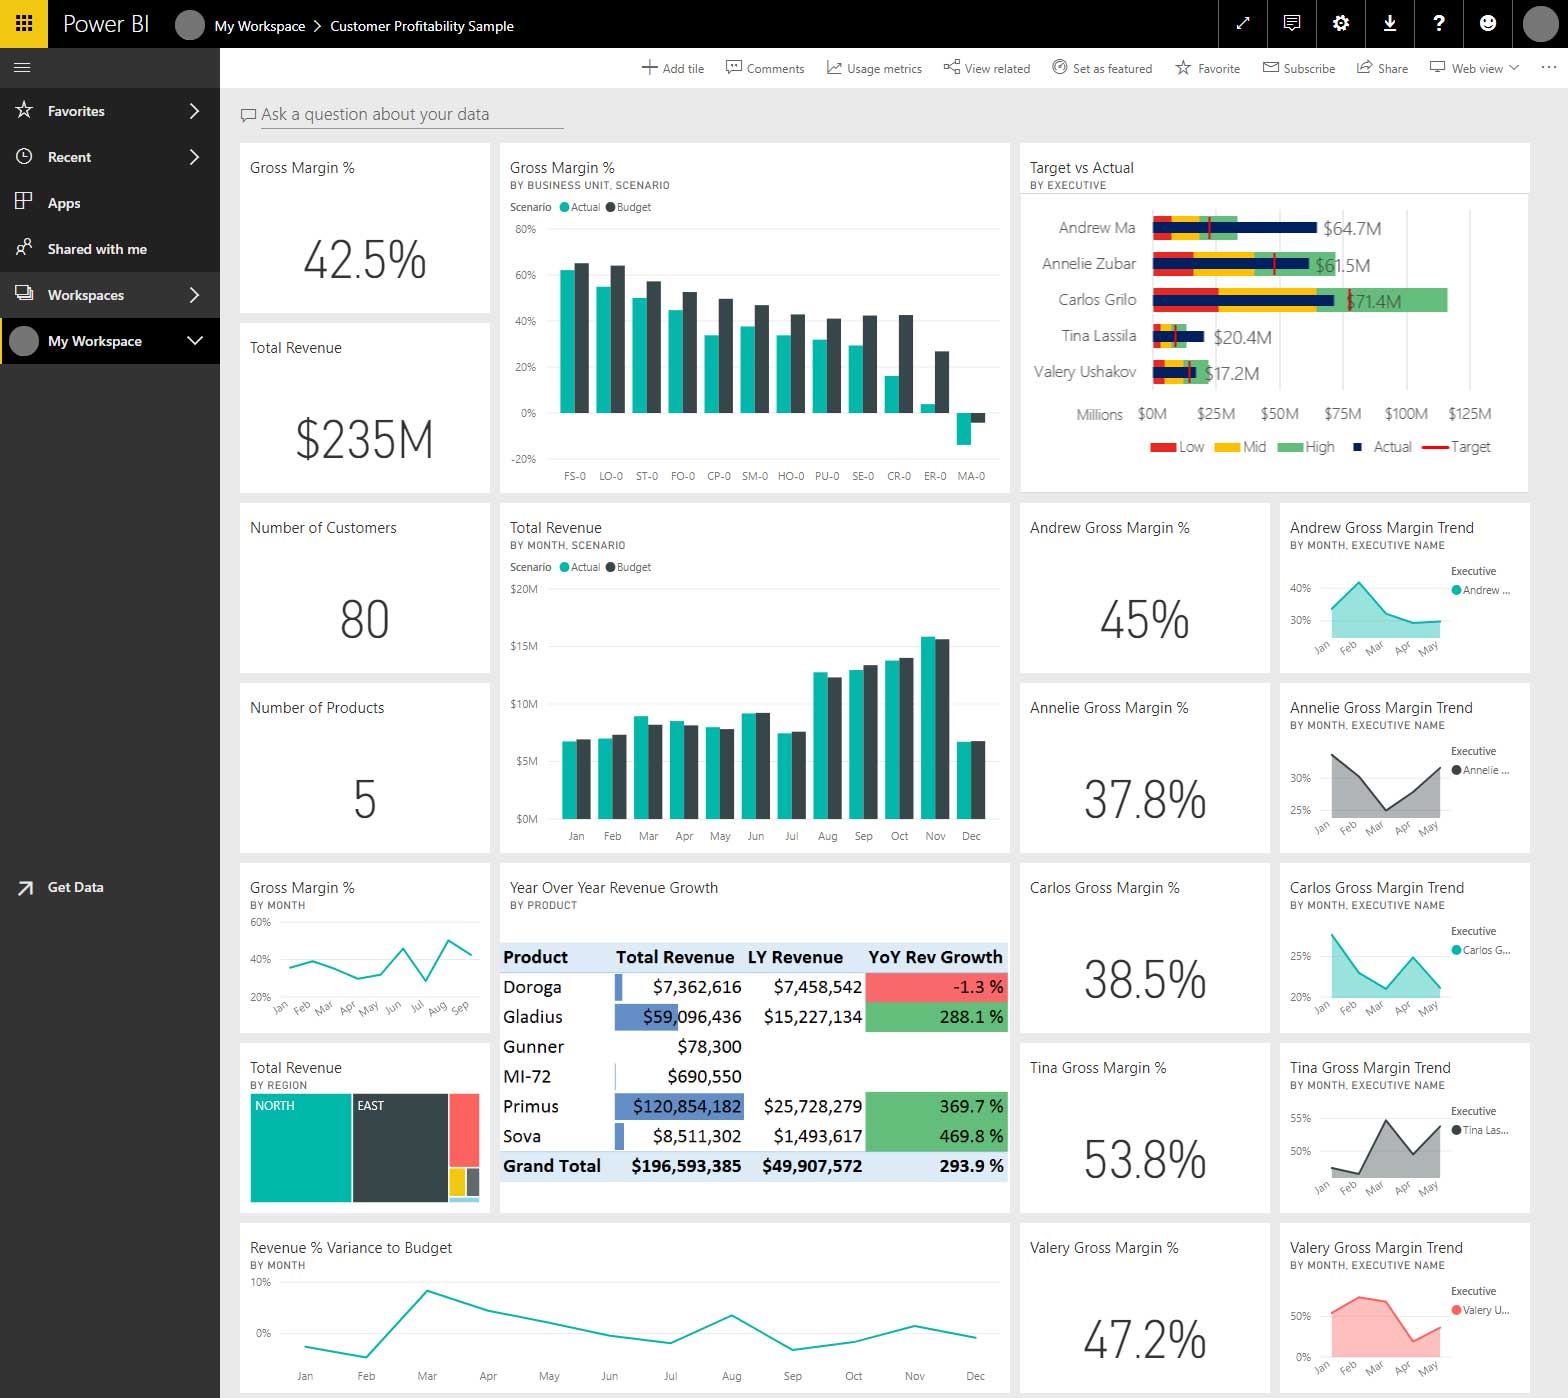
Dashboard screenshot

What specifically distinguishes this tool is the data visualization option, which allows:

power bi customer profitability

Creating custom data models contributes to:

  • Creating the content of the report according to the needs of different levels of company management
  • Creating a connection, custom metrics, hierarchies, key business indicators
  • Quick and easy data analysis

Searchable datasets enable searching for corporate data managed by the IT sector or queries saved in Power BI. In addition, it is possible to monitor data usage within the organization at any time. Reports are based on HTML5 technology and can be accessed from any mobile device.

Informatika’s specialists are there to help introduce and configure BI tools in the company, as well as provide business consulting and specialist training in an authorized Microsoft Teaching Center.

Advantages of Power BI:

  • Flexibility – which the user counts on when downloading data from a source. The source of data accessed by Power Excel can also be in other formats (CSV, XML, SQL, Azure, SharePoint List, SAPP Business Object, and others).

  • Time-saving that is achieved by:

    • The option that any intention to complement new data is simply executed.
    • Technical predispositions that allow you to quickly download data from a document whose size reaches up to 256 MB (approximately up to 100 million lines).
  • Visualizations of dynamic reviews that can fit into a single worksheet – thus users are spared the strenuous browsing in order to obtain the desired answers that can help them make business decisions by inspecting different worksheets.

  • Creating reports with complex conditions – thanks to additional modules that are specifically developed, it is possible to meet very complex requirements. Namely, with the help of formulas, it is possible to display the data in the report and compare the results with data that are a result of changes from a parallel period.

The sectors that most often use Power BI:

  • Controlling – people who are intensively engaged in controlling will recognize the use value of the tools as they, within their job, to a large degree use the predefined reports contained in the so-called Core systems as well as certain reports that are done at the request of the user.

  • Risks – represent a group of users who often run processes from the Data Quality domain, so they need more powerful tools than traditional Excel, which can extract certain data anomalies and address them correctly.

  • Sales, purchase, marketing – now have the available tools that are able to perform operations with tens of millions of data very quickly, which will allow them to reliably and promptly examine the essential elements of the current changes.

  • IT sector – represents a new group of users that traditionally did not deal with this tool, but new tools (especially the Power Query scripts) will surely interest these users as well. At the same time, because they understand how the database works, they should be expected to help colleagues from the aforementioned groups in the realization of certain complex tasks.

  • Others – all who work intensively on data processing and spend on average no less than four hours a day working in Excel.